Title here
Summary here
What it means: The case’s SLA deadline has passed and the case has not been closed. The daily maintenance job (running every 24 hours) identifies breaches and marks the slaBreached flag.
Visual indicators:
What to do when a case is breached:
Note: Clearing the breach flag requires closing the case. There is no manual “clear breach” action. Once a case is breached, the badge persists until the case transitions to Closed.
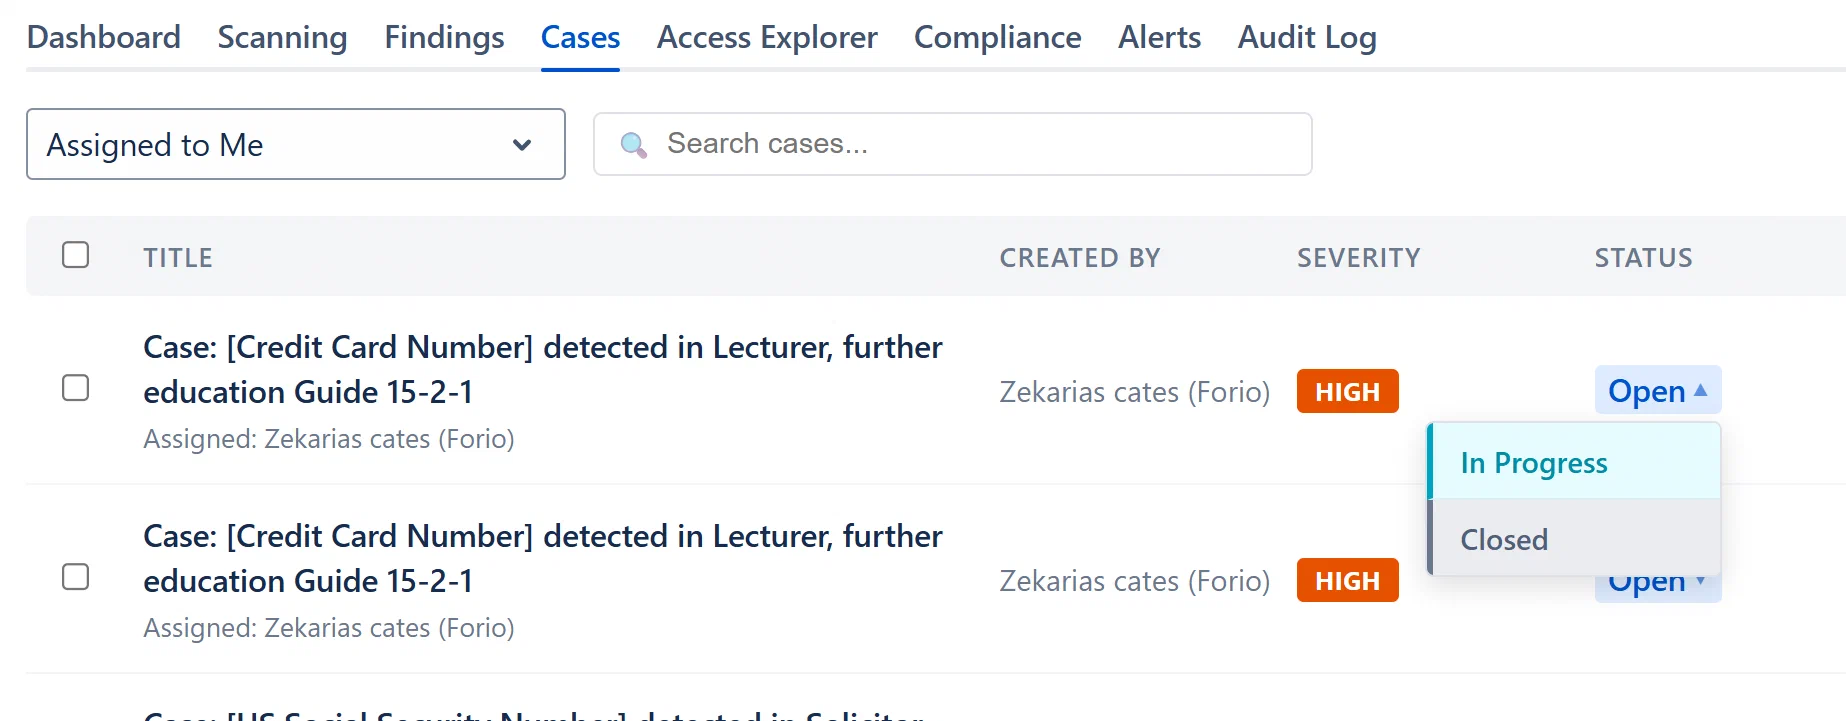
The toolbar at the top of the Cases tab provides two filtering mechanisms:
Status filter (dropdown): Select from:
Search bar (free text): Searches case Title, Severity, and Status fields in real time. Results update as you type.
These two filters work together. For example: set the dropdown to “Active” and type “engineering” in the search bar to find active cases with “engineering” in the title.
The cases list is a row-based table. Each row represents one case. Columns are:
| Column | Content |
|---|---|
| Checkbox | Select for bulk actions (Analyst+ only) |
| Title | Case title in bold; assignee name shown below in muted text |
| Created By | Display name of the reporter |
| Severity | Colored badge: Critical (red), High (orange), Medium (blue), Low (green) |
| Status | Quick-action dropdown (Analyst+) or static badge (Viewer) |
| Findings | Count of linked findings |
| SLA | Deadline date OR bold red “BREACHED” lozenge |
| Created | Relative timestamp |
Click anywhere on a row to open the Case Detail modal.
Pagination: Cases are paginated at 15 rows per page. The page indicator shows “Page X of Y (N cases)”. Use Previous / Next buttons to navigate.