The Dashboard tab is the first tab (index 0) in the main Aegis panel and is shown by default when you open the app. To navigate to it from any other tab, click the Dashboard tab label in the tab row at the top.
Direct navigation from other tabs: The stat cards on the Dashboard tab are clickable. Clicking a stat card navigates you directly to the relevant tab with filters pre-applied. For example, clicking “Critical Findings” takes you to the Findings tab filtered to Critical severity.
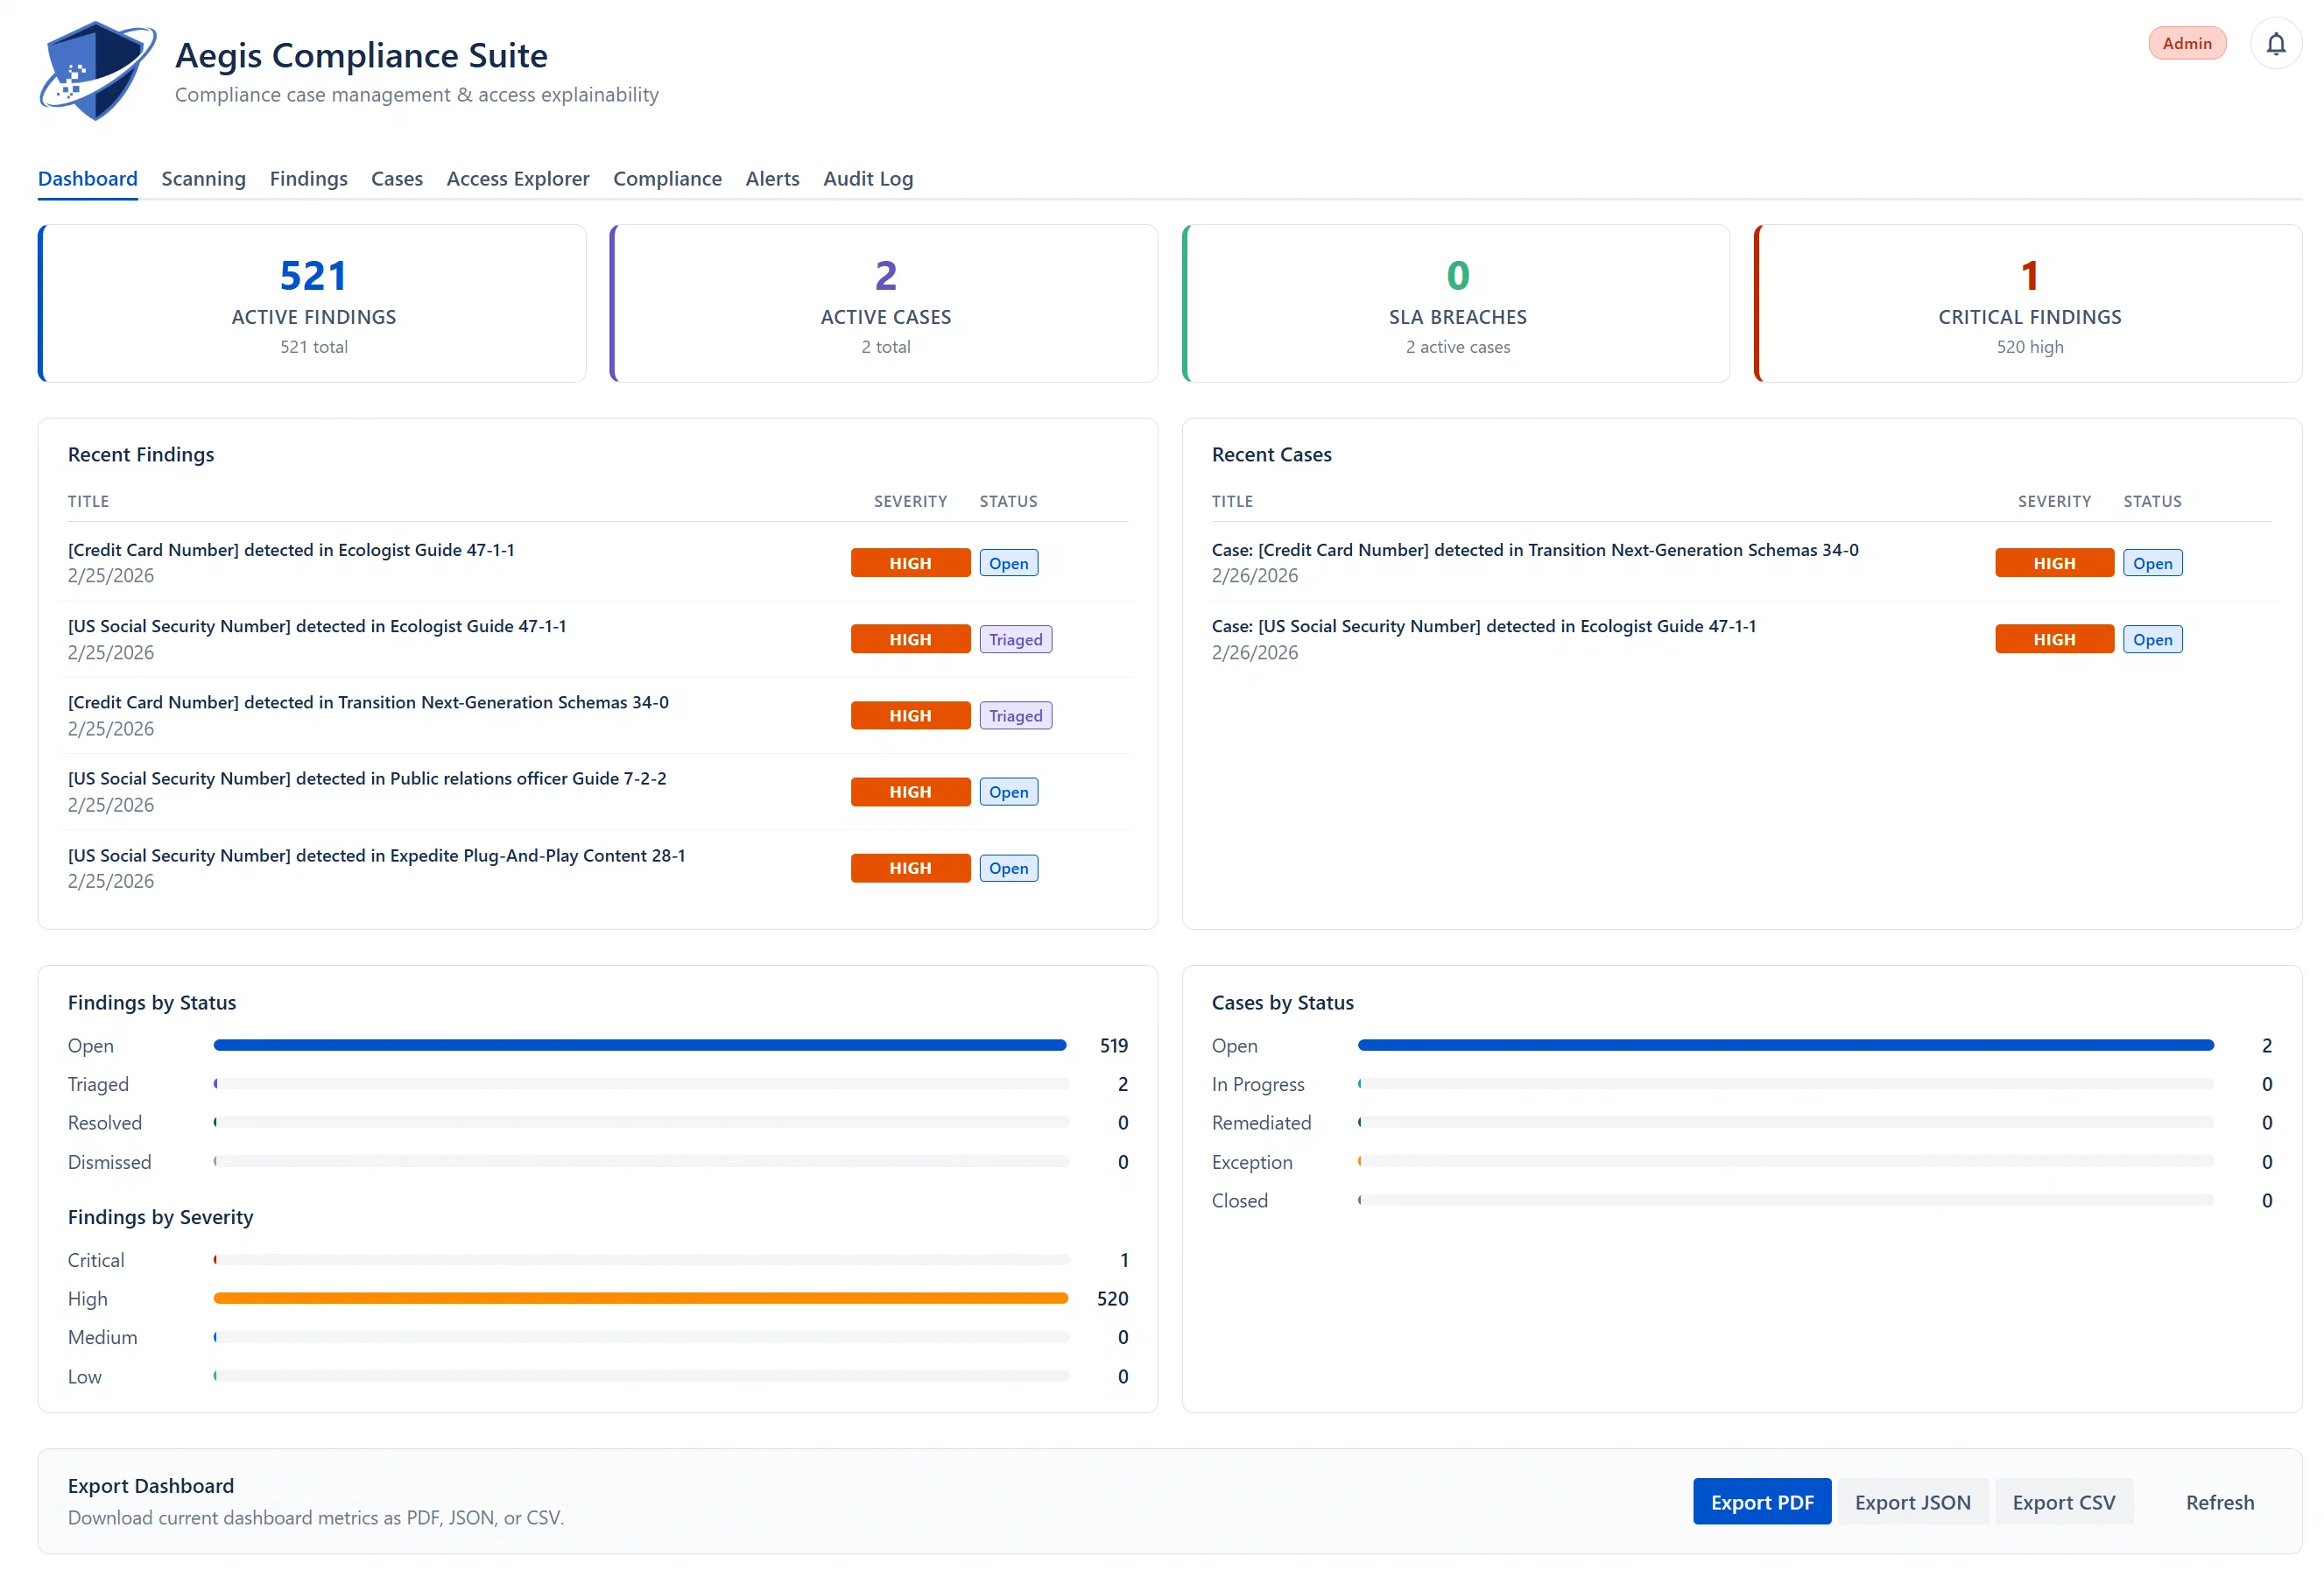
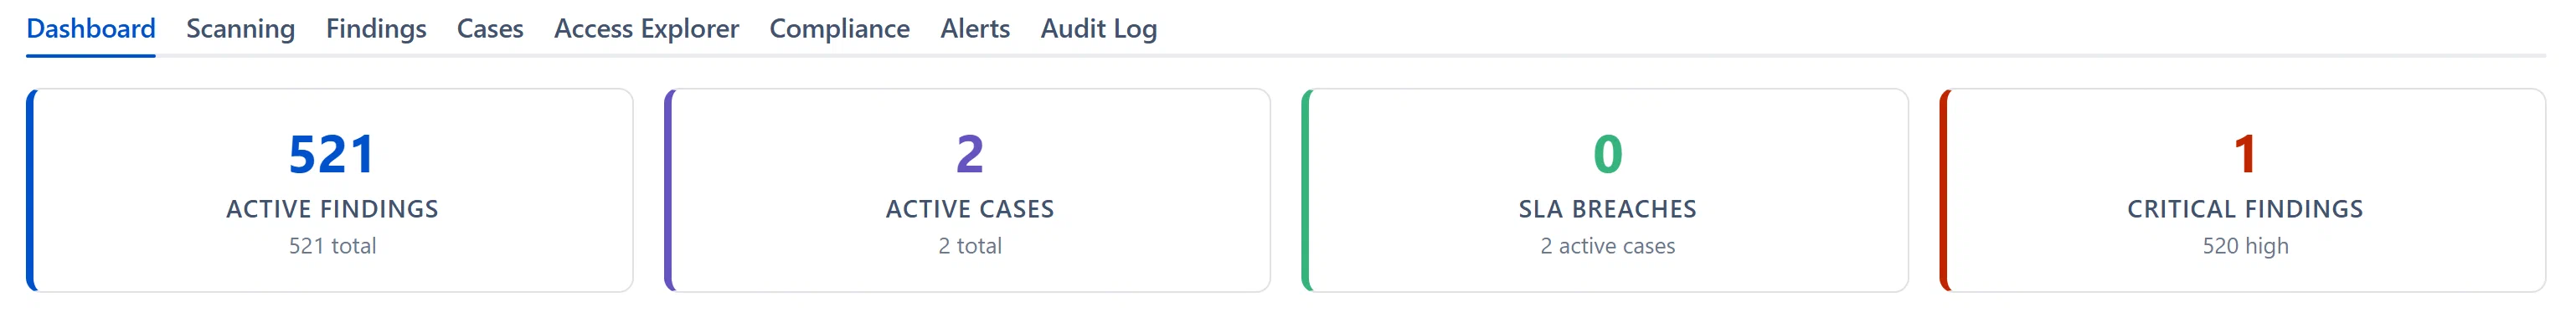
The Dashboard tab displays four clickable stat cards at the top of the page. These cards read from a pre-computed counter cache for instant load times.
Displays: Count of findings currently in Open or Triaged status combined.
Sub-label: Total findings across all statuses (Open + Triaged + Resolved + Dismissed).
Clicking it: Navigates to the Findings tab with the filter set to “Active (Open + Triaged)”.
What “active” means: A finding is active if it still represents an unresolved risk. Open means it has been detected but not yet reviewed. Triaged means a team member has acknowledged it and it is under investigation.
Note: Resolved and Dismissed findings do not count toward “Active Findings”. Resolved means the issue has been fixed. Dismissed means the finding was intentionally excluded (e.g., a known false positive or an accepted minor risk).
Displays: Count of cases currently in Open or In Progress status combined.
Sub-label: Total cases across all statuses.
Clicking it: Navigates to the Cases tab filtered to active cases.
What “active cases” means: Open cases have been created but not yet assigned or started. In-Progress cases are being actively worked on by an assignee.
Displays: Count of cases whose SLA deadline has passed without being resolved or closed.
Sub-label: Total number of active cases (Open + In Progress).
Color: The card turns red when any SLA breach exists, and green when all cases are within SLA.
Clicking it: Navigates to the Cases tab filtered to SLA-breached cases only.
Default SLA deadlines (configurable in Admin > Scoring & SLA):
Critical cases: 24 hours
High cases: 72 hours (3 days)
Medium cases: 168 hours (7 days)
Low cases: 720 hours (30 days)
Warning: An SLA breach does not automatically close or reassign a case. It only flags the case and triggers any configured SLA Breach alert rules. Your team must still manually address the overdue case.