Activity Panels & Export

Findings by Status and Severity

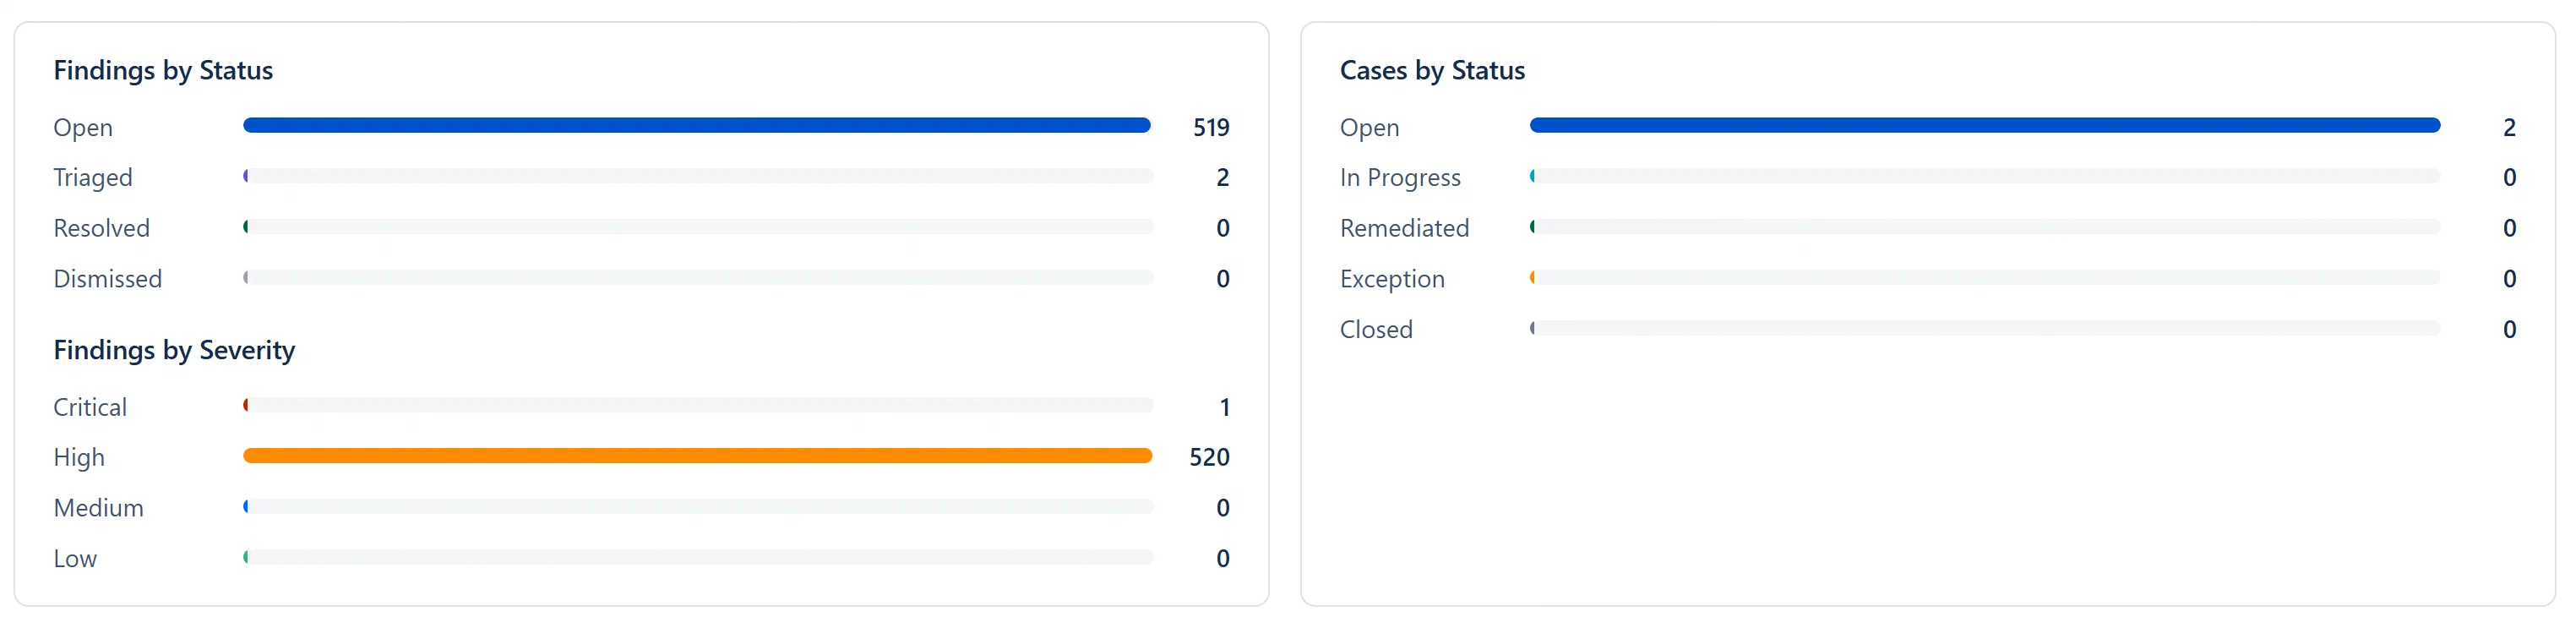
Below the KPI cards, the Dashboard shows two side-by-side panels with horizontal bar charts:

Left panel. Findings Breakdown:

  • Findings by Status: Horizontal bars showing Open (blue), Triaged (purple), Resolved (green), Dismissed (gray) counts relative to the total. Each bar is clickable, clicking navigates to the Findings tab filtered to that status.
  • Findings by Severity (below the status bars): Critical (dark red), High (orange), Medium (blue), Low (green) bars. Each bar is clickable to filter findings by that severity.

Right panel. Cases by Status:

  • Horizontal bars showing Open (blue), In Progress (teal), Remediated (green), Exception (orange), Closed (gray). Each bar is clickable to filter the Cases tab.

Two-column bar chart panels. Findings by Status/Severity and Cases by Status


Recent Findings List

The Recent Findings panel shows up to 5 of the most recently created or updated findings.

Columns:

ColumnDescription
TitleThe finding title. Clicking the row opens the Finding Detail Modal for full details.
SeverityColor-coded badge: Critical (dark red), High (orange), Medium (blue), Low (green), Info (gray).
StatusCurrent status badge: Open (blue), Triaged (purple), Resolved (green), Dismissed (gray). A finding that was previously resolved but detected again by the scanner shows a “Reopened” badge in orange.
  • The Created date is shown in muted text below the title.
  • Clicking any row opens the Finding Detail Modal for that finding without leaving the Dashboard tab.

Recent Findings panel, 5 rows with title, severity badge, status badge


Recent Cases List

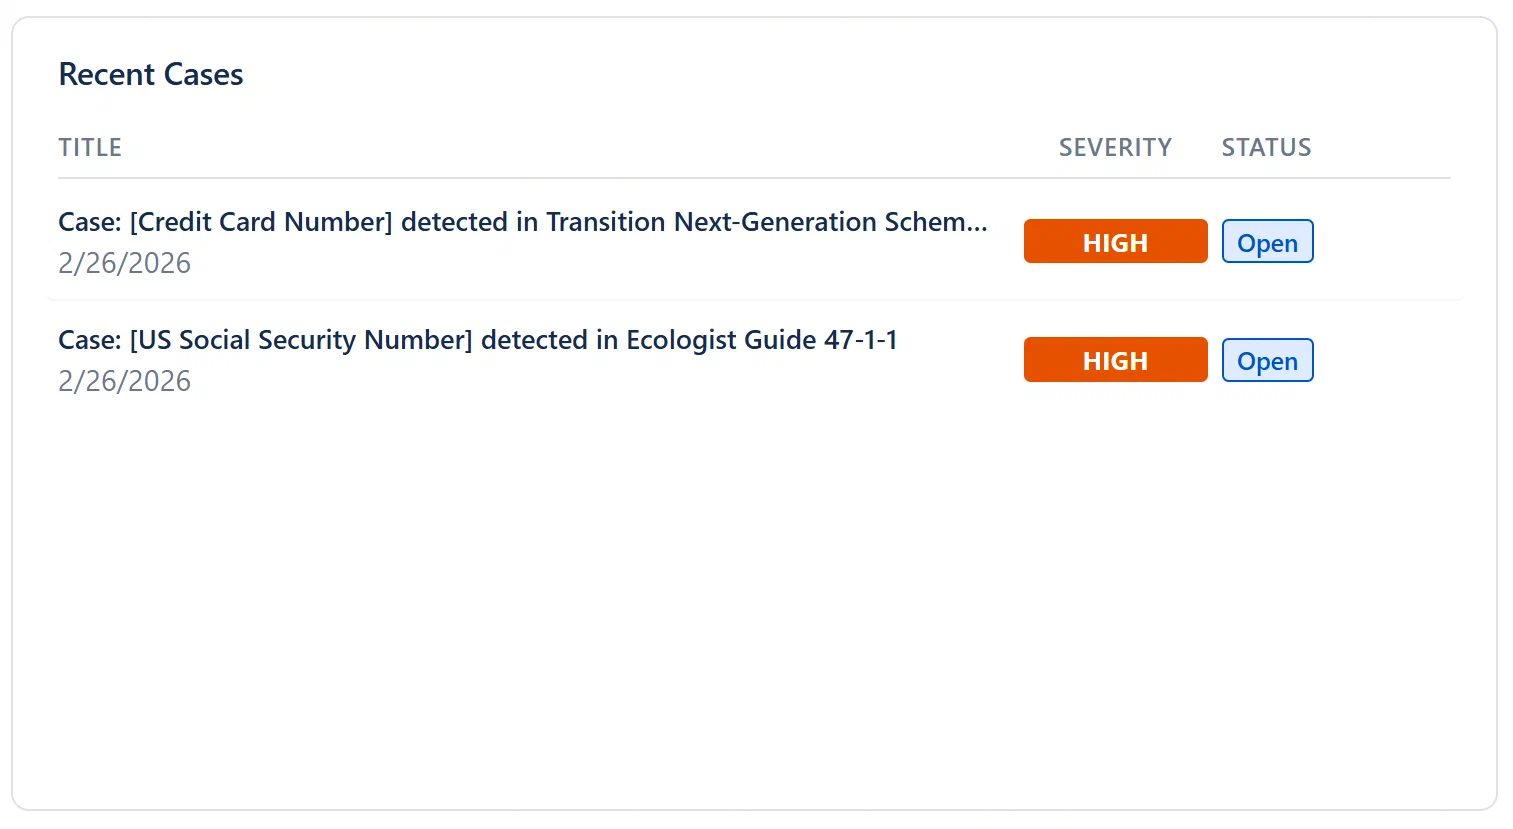
The Recent Cases panel shows up to 5 of the most recently created or updated cases.

Columns:

ColumnDescription
TitleCase title. Clicking the row opens the Case Detail Modal.
SeveritySame color coding as findings.
StatusOpen, In Progress, Remediated, Exception, Closed.
  • If a case has breached its SLA, a red "· SLA" label appears next to the creation date.
  • Clicking any row opens the Case Detail Modal for that case directly from the Dashboard.

Recent Cases panel, row with red “SLA” indicator visible


Onboarding Banner

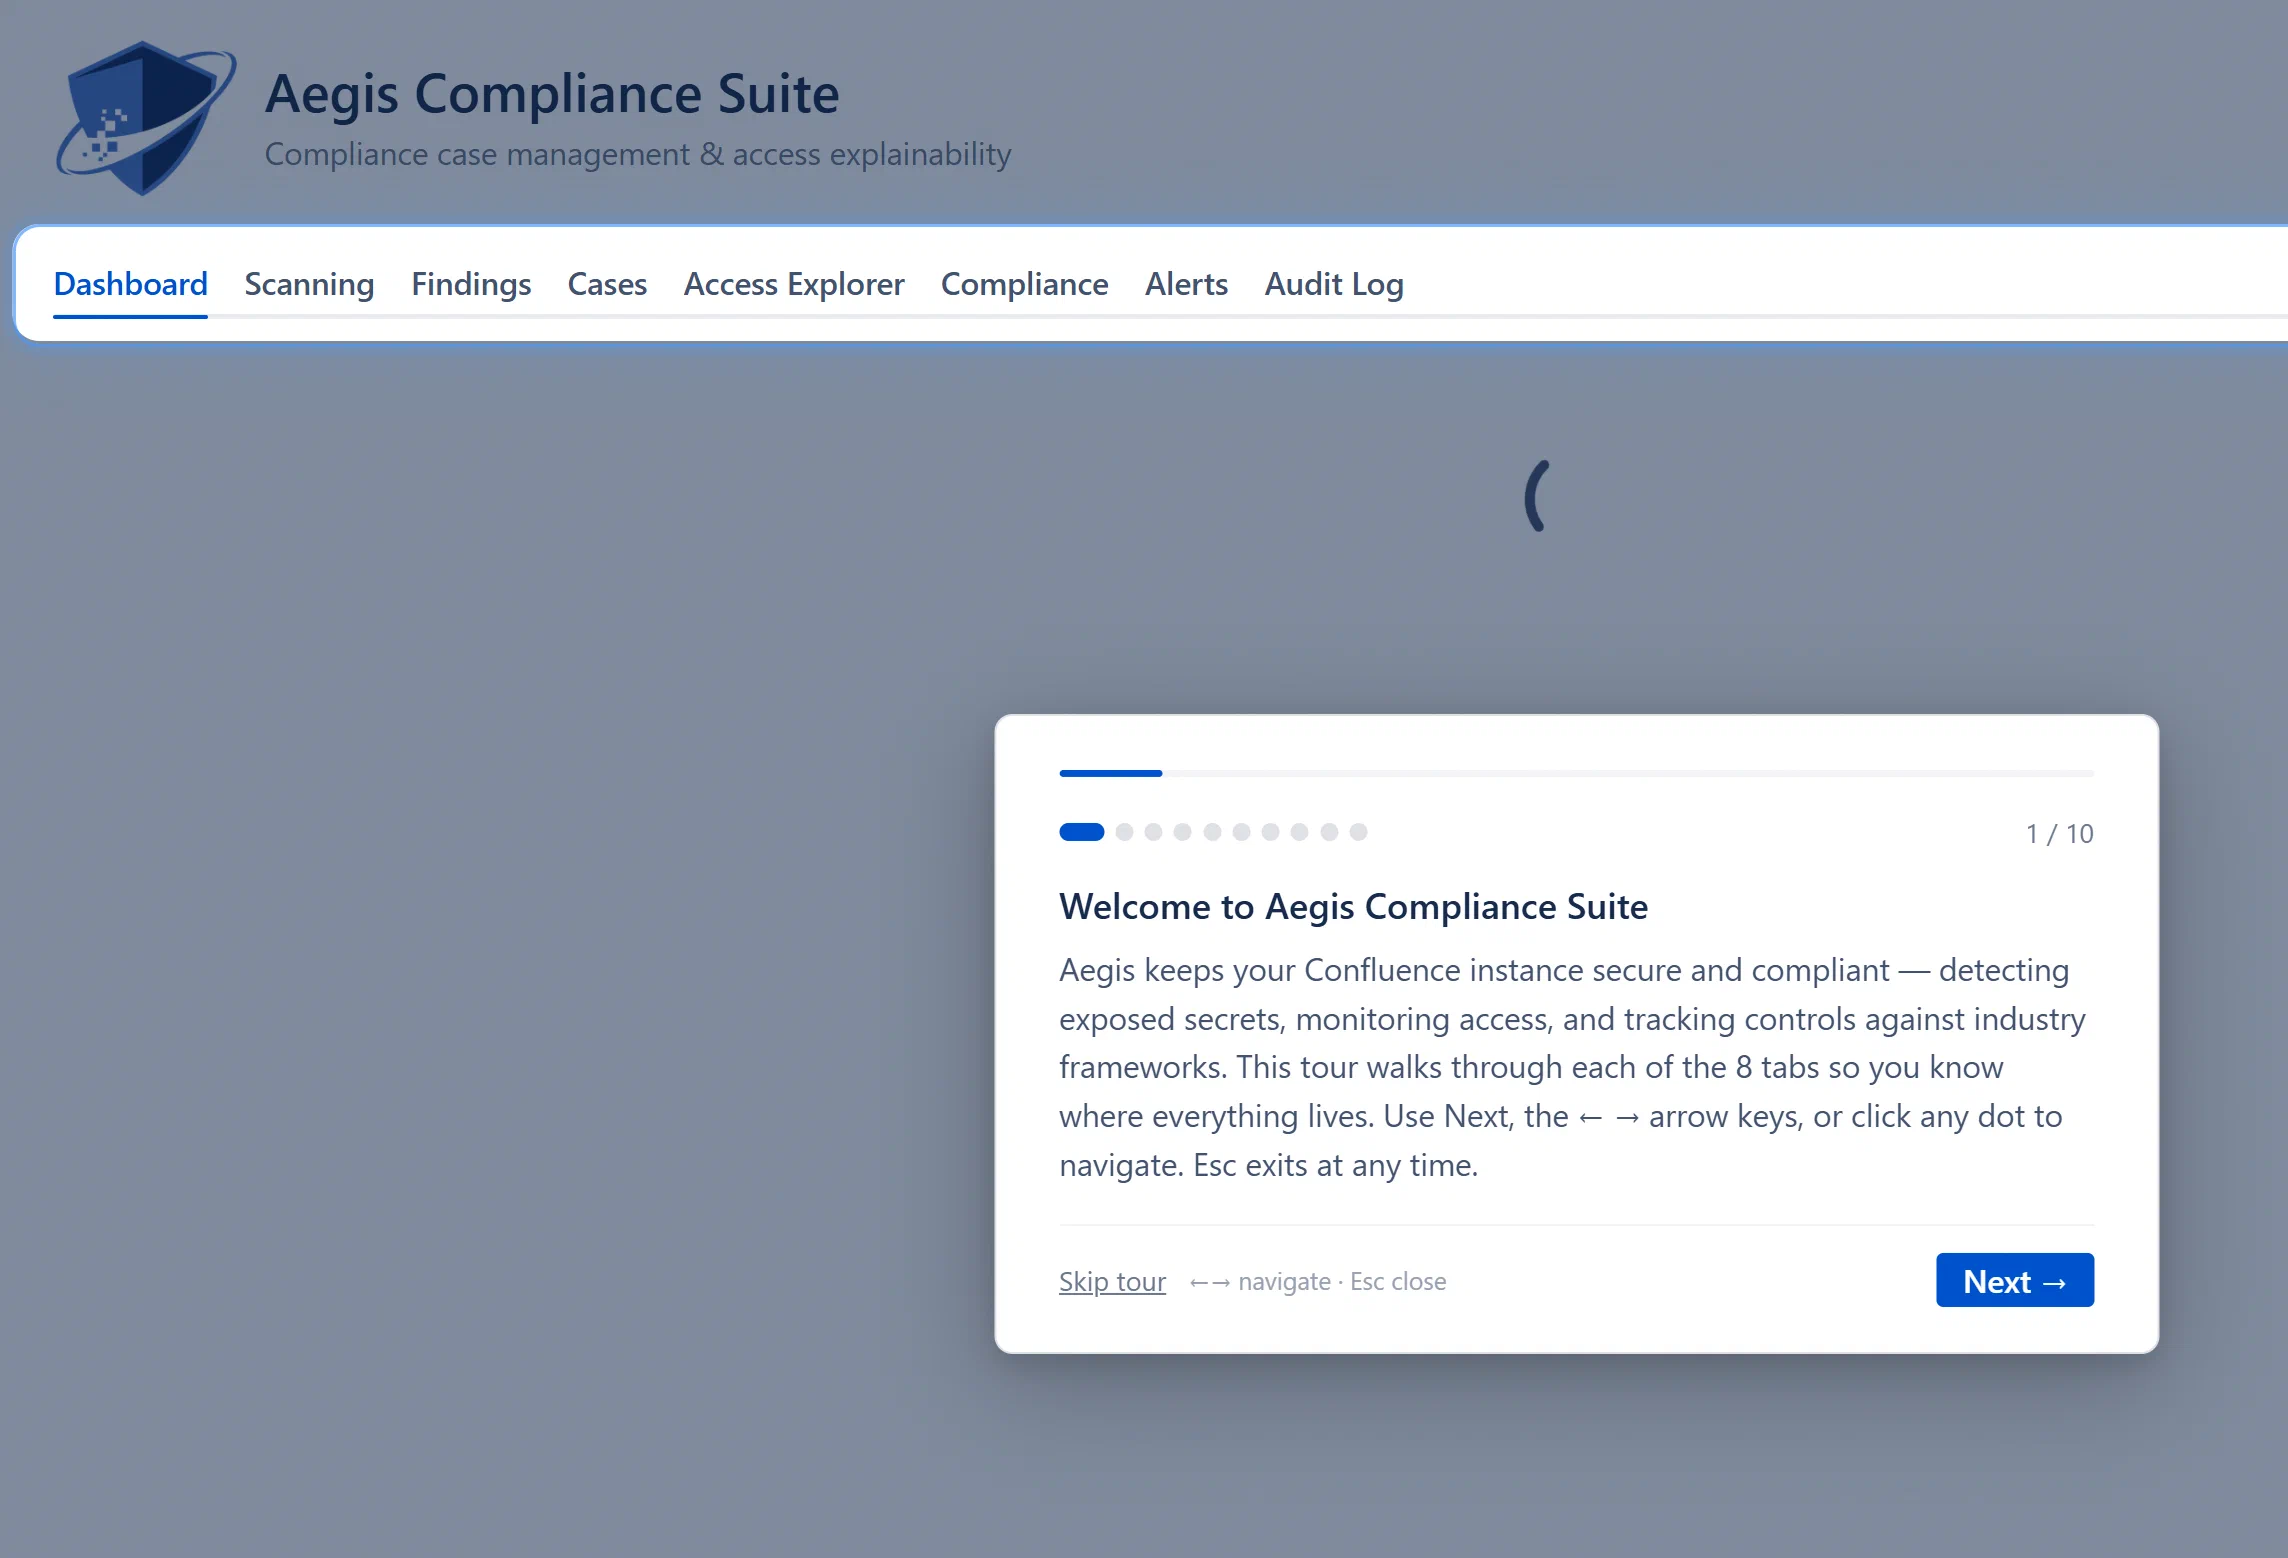
When you first install Aegis and have not yet created any findings or cases, an onboarding banner appears at the top of the Dashboard tab. The banner prompts you to:

  1. Run your first content scan
  2. Review detected findings
  3. Set up alert rules

The onboarding banner disappears automatically once at least one finding or one case exists. It cannot be manually dismissed, it is tied to actual data presence, not a flag. This ensures new installations are guided through setup without being permanently suppressible.

Onboarding banner with four suggested action links


Export Dashboard

At the bottom of the Dashboard tab is an Export Dashboard section with three buttons:

  • Export PDF: Captures the entire dashboard panel as a PDF using client-side rendering (via jsPDF). This is a visual capture, it reflects exactly what is shown on screen at the time of export.
  • Export JSON: Downloads a JSON file with all current metric data: finding counts by status and severity, case counts by status, SLA stats, and the 5 most recent findings and cases.
  • Export CSV: Downloads a CSV summary of the dashboard metrics. This is a tabular representation (one row per metric), suitable for loading into a spreadsheet or BI tool.

Note: PDF fidelity depends on the browser’s rendering engine. For the highest-fidelity PDF, use your browser’s built-in Print → Save as PDF functionality instead.


Refresh Button

A Refresh button appears next to the Export buttons. Clicking it forces an immediate re-fetch of all dashboard data and clears the tab cache for the Dashboard tab. This is useful after you have made changes in another tab and want to see the updated counts without switching tabs.

A brief “Updating…” spinner indicator appears at the top of the section while background refreshes are in progress (this is the SWR pattern, stale data is shown immediately while fresh data is being fetched).


Suggested Workflow for New Users

When you first land on the Dashboard and see all zeros:

  1. Click “Scanning” at the top to go to the Scanning tab and run your first content scan. This populates findings.
  2. Return to Dashboard: Active Findings and Critical Findings should now show counts.
  3. Click Active Findings to jump to the Findings tab with active findings pre-filtered.
  4. Triage or Resolve findings that are clearly false positives. Escalate genuine security risks into Cases.
  5. Check back daily: the SLA Breaches card will alert you to overdue remediation work.