Finding Detail Modal

Finding Detail Modal

Clicking any finding in the Findings table (or in the Recent Findings panel on the Dashboard) opens the Finding Detail Modal: a large overlay that shows all information about the finding and provides action buttons for managing it.

Finding Detail Modal, full view with action bar, description, sidebar metadata

  • Title: The finding title in large text.
  • Severity badge: Color-coded severity lozenge.
  • Status badge: Current status lozenge.
  • Scanner Reopened lozenge (if applicable): An orange “Scanner Reopened” lozenge appears if the finding was reopened by the scanner after a previous resolution.

Action Bar (Analyst+ only)

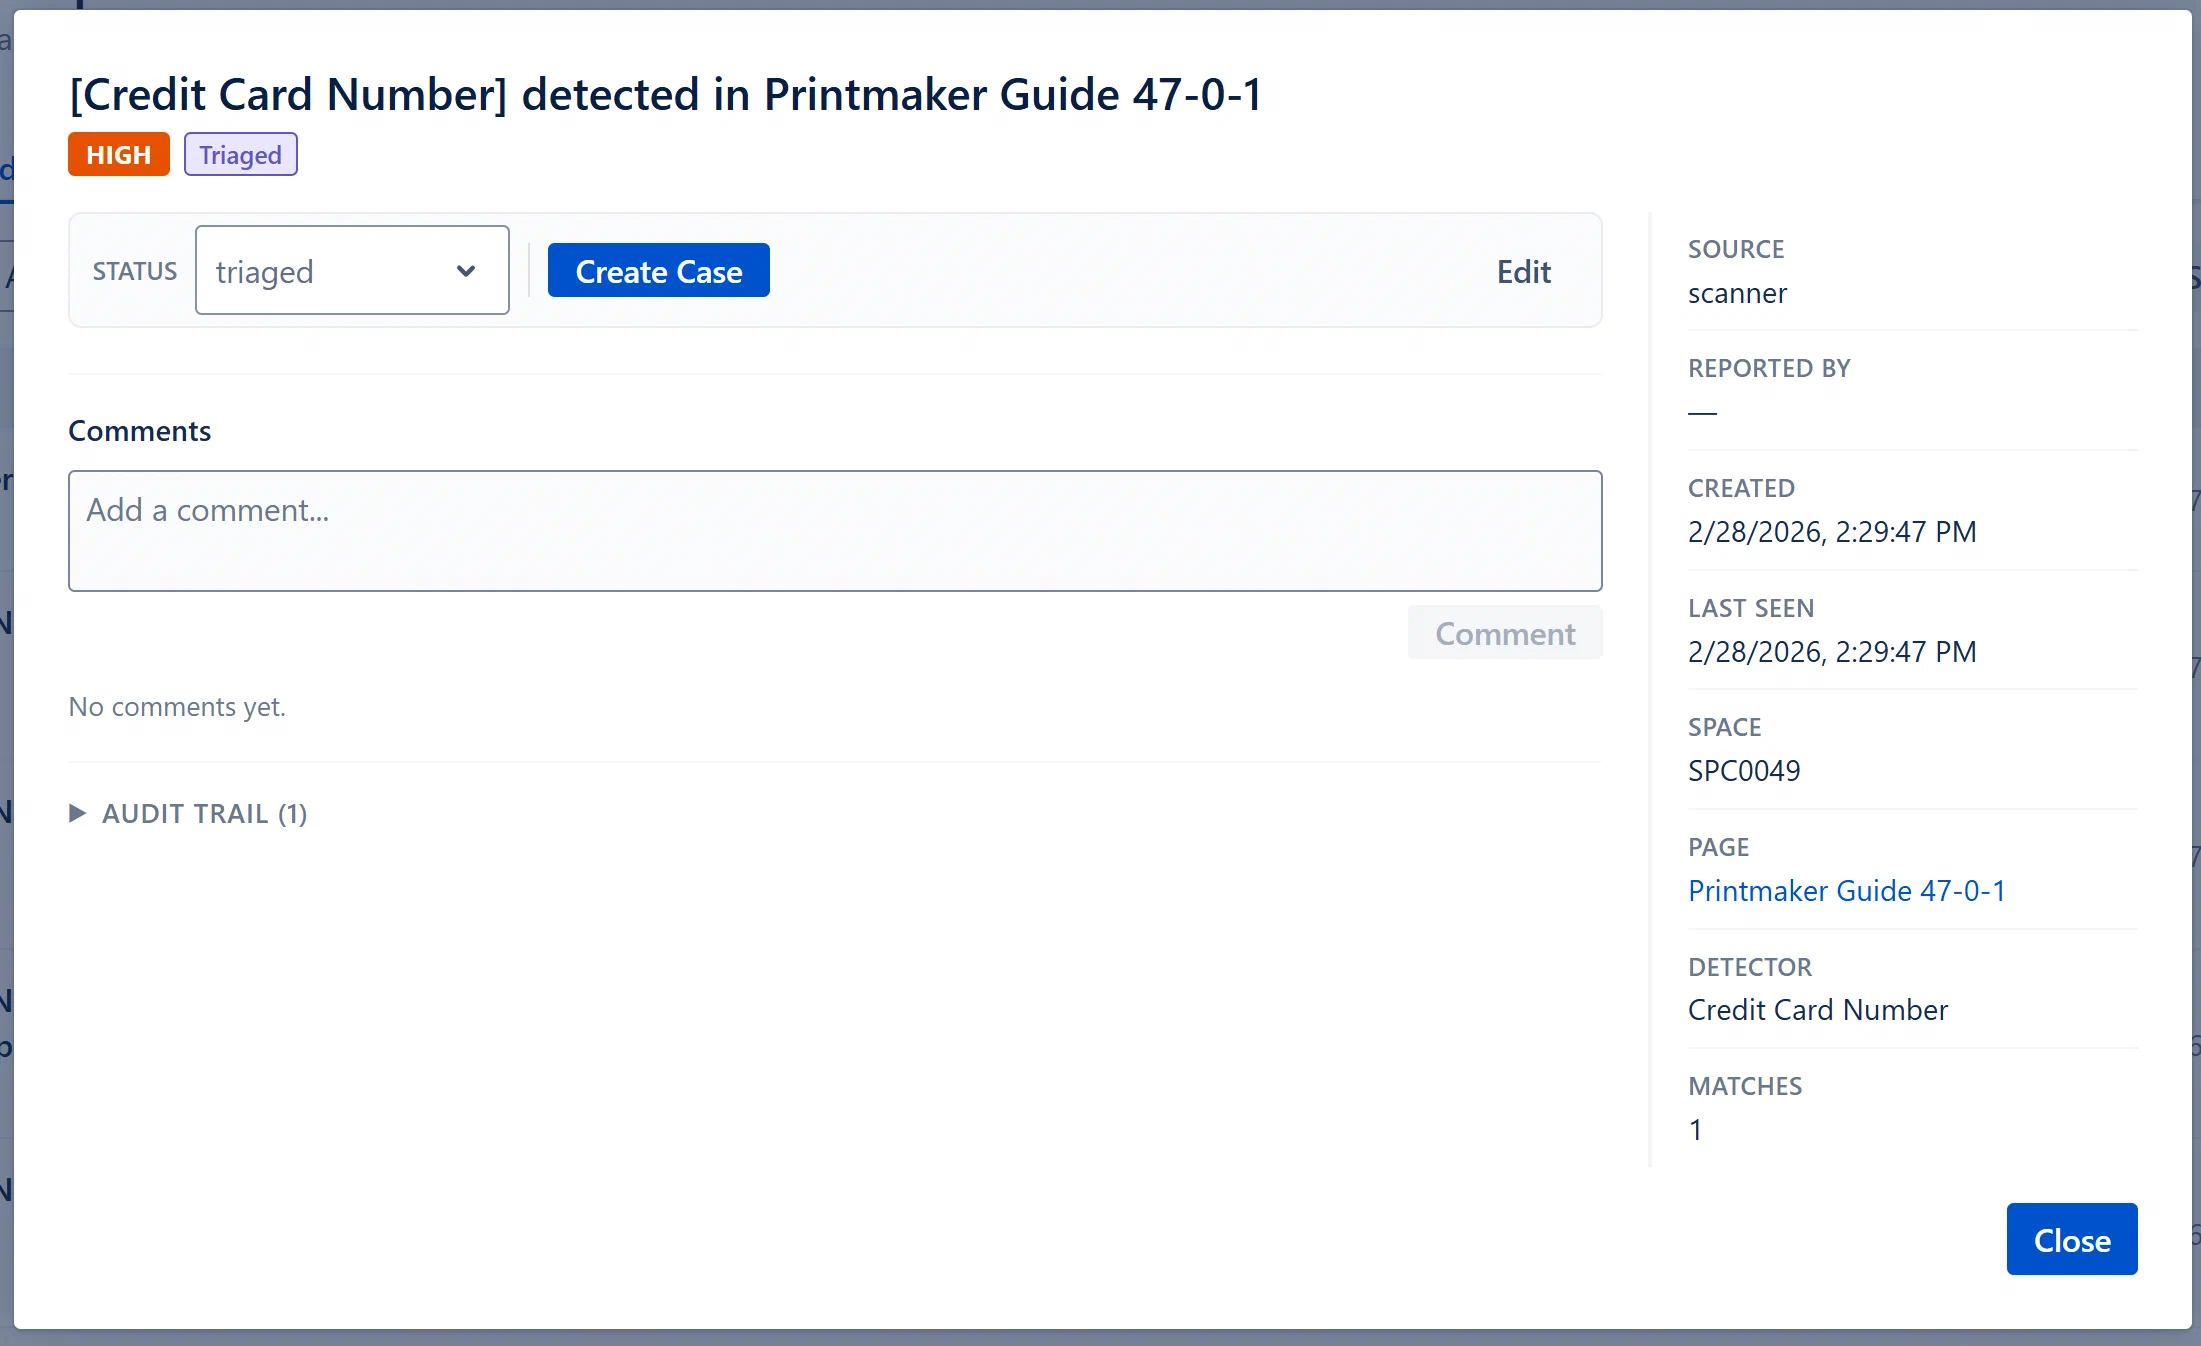
A horizontal action bar appears at the top of the modal body for users with Analyst role or above. It contains:

Status Dropdown:

  • Label: “Status”
  • Shows the current status as a placeholder.
  • Dropdown options: all statuses except the current one.
  • Selecting a new status immediately saves the change and refreshes the finding. The status badge in the header updates in real time.

Create Case Button (if no case linked):

  • Clicking creates a new case linked to this finding, with the case title pre-populated as “Case: [finding title]” and severity matching the finding.
  • After creation, the button is replaced by a green “Case Linked” badge and a “View Case →” link.

“Case Linked” Badge + “View Case →” link (if a case is already linked):

  • Shown instead of the Create Case button.
  • Clicking “View Case →” closes this modal and opens the linked case’s detail modal.

Create Jira Ticket Button (Analyst+, only if Jira integration is enabled and no ticket yet exists):

  • Creates a Jira issue in the configured project, linked to this finding.
  • After creation, the button is replaced by a lozenge showing the Jira issue key (e.g., “SEC-42”). If the Jira browse URL was resolved, the key is a clickable link that opens the issue in Jira.

Edit Button:

  • Clicking “Edit” switches the modal body to edit mode.
  • In edit mode, you can modify the Title, Description, Severity, and Tags.
  • Click Save Changes to persist. Click Cancel to discard.
  • Saving triggers a full finding reload and calls onUpdated to refresh the parent list.

Description and Tags

Below the action bar:

  • Description: The full finding description is shown as a paragraph.
  • Tags: Each tag is displayed as a gray lozenge below the description.

Comments Section

A CommentsSection component is rendered below the description, allowing users to add threaded comments to this finding. Comments are persisted and visible to all users who can view the finding.

Audit Trail

A collapsible “Audit Trail (N)” toggle appears below the comments. Clicking it expands a chronological list of all evidence events for this finding, showing:

  • Timestamp (localized date/time)
  • Action lozenge (e.g., “finding created”, “finding status changed”, “finding linked to case”), underscores are replaced with spaces for readability.
  • Actor (“by [display name]”), the user who performed the action.

The audit trail is collapsed by default to reduce visual noise. The count in parentheses tells you how many events exist without expanding.

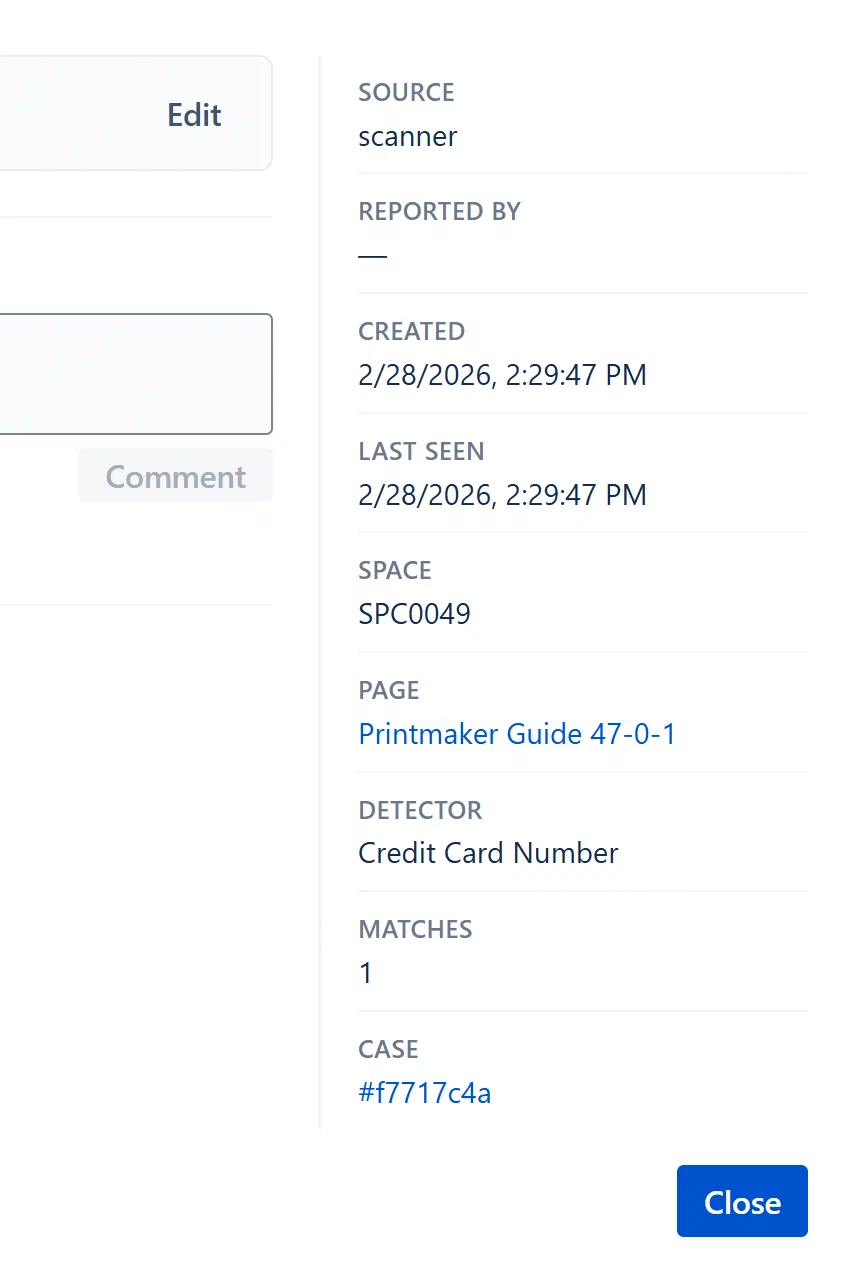
A right sidebar shows structured metadata:

LabelValue
Sourcescanner, manual, or csv
Reported ByDisplay name, or “Aegis Scanner” / “System”
CreatedFull localized date/time
ReopenedDate/time when last reopened by scanner (only if applicable)
Last SeenFor scanner findings: when the scanner last confirmed the content still matched
SpaceConfluence space key
PageConfluence page title as a clickable link (navigates to the Confluence page in the same tab)
DetectorDetector name for scanner findings (e.g., “aws-key”)
MatchesNumber of regex matches on the page (for scanner findings with multiple hits)
CaseLinked case ID (first 8 chars) as a clickable link (navigates to that case)
JiraJira issue key as a clickable link (if a ticket exists and Jira is enabled)

Finding Detail Modal sidebar, metadata items Source, Reported By, Space, Page (with link), Detector, Case link