Four clickable stat cards appear below the toolbar. Each card expands to show a detail panel when clicked. While a scan is running, the Scanner Status card expands automatically and displays the real-time progress view inside it.
Displays: The current scan status as a colored lozenge:
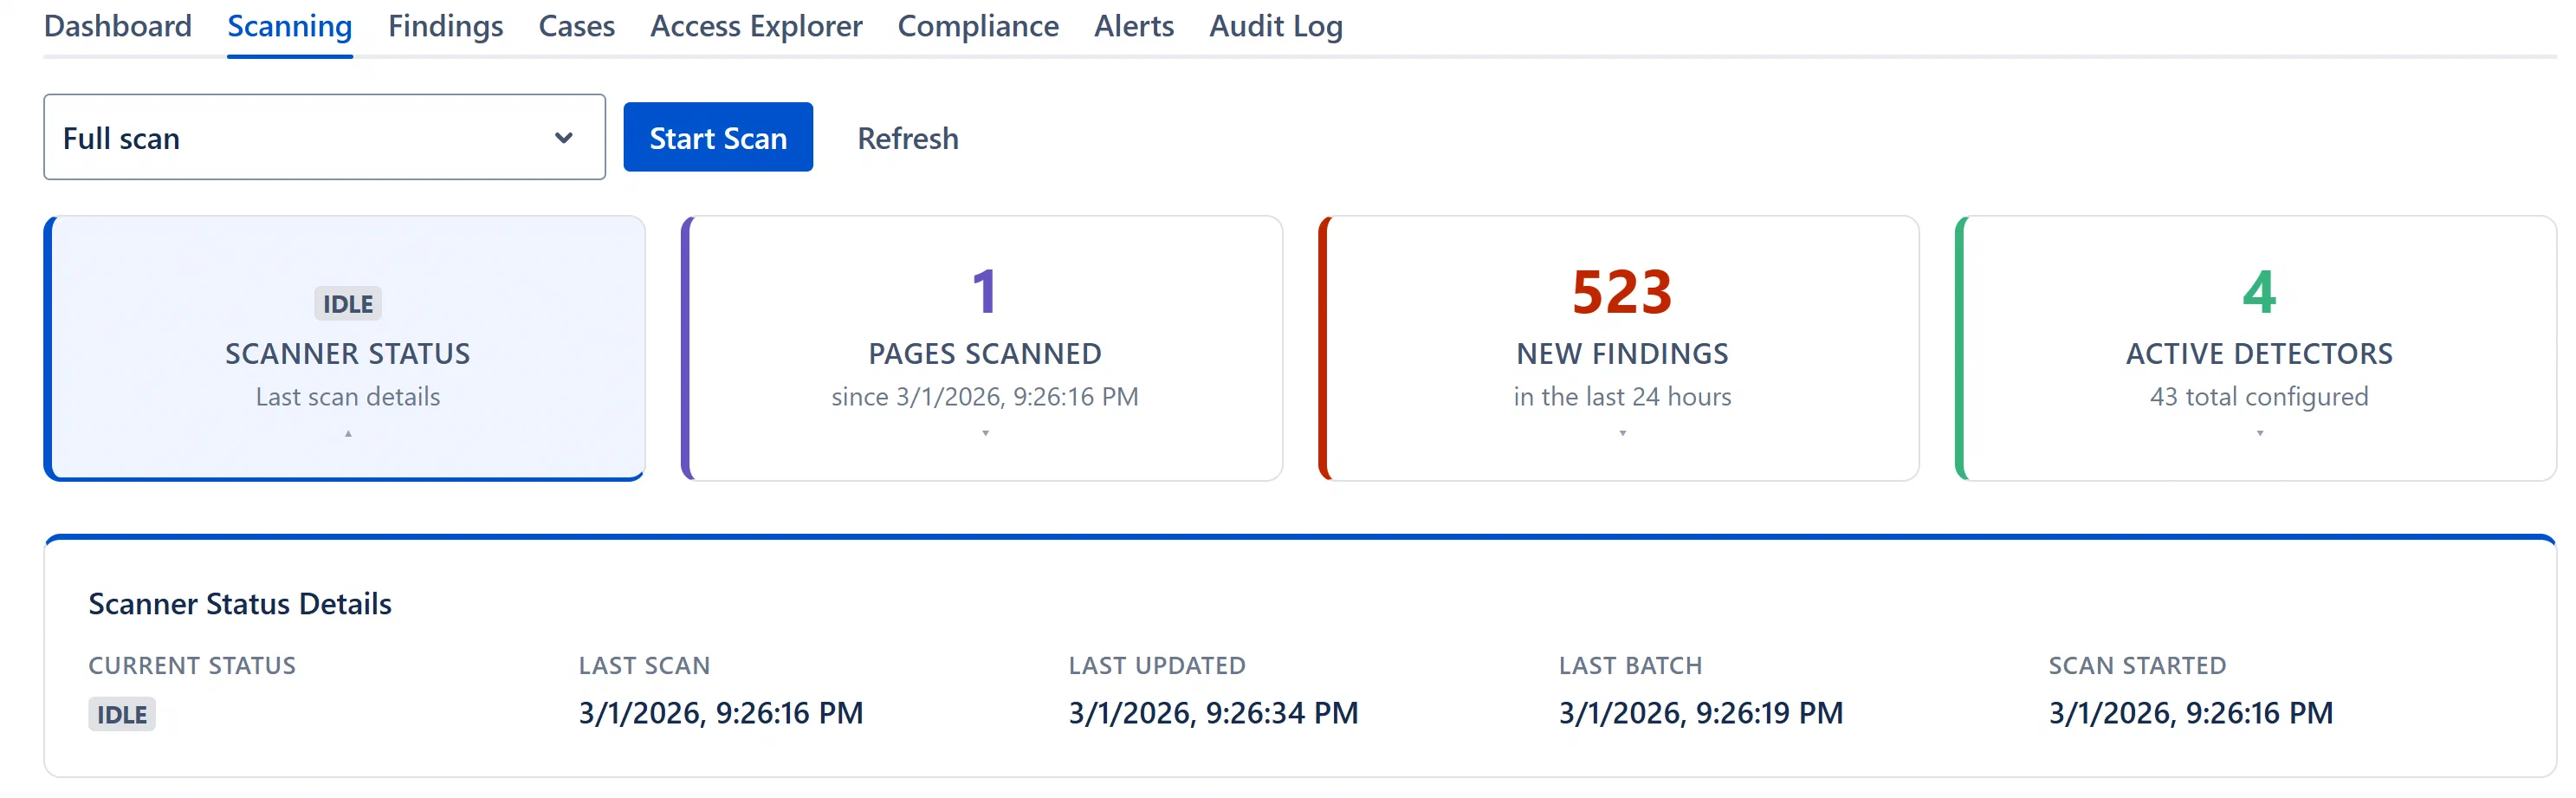
IDLE (gray): No scan is running.
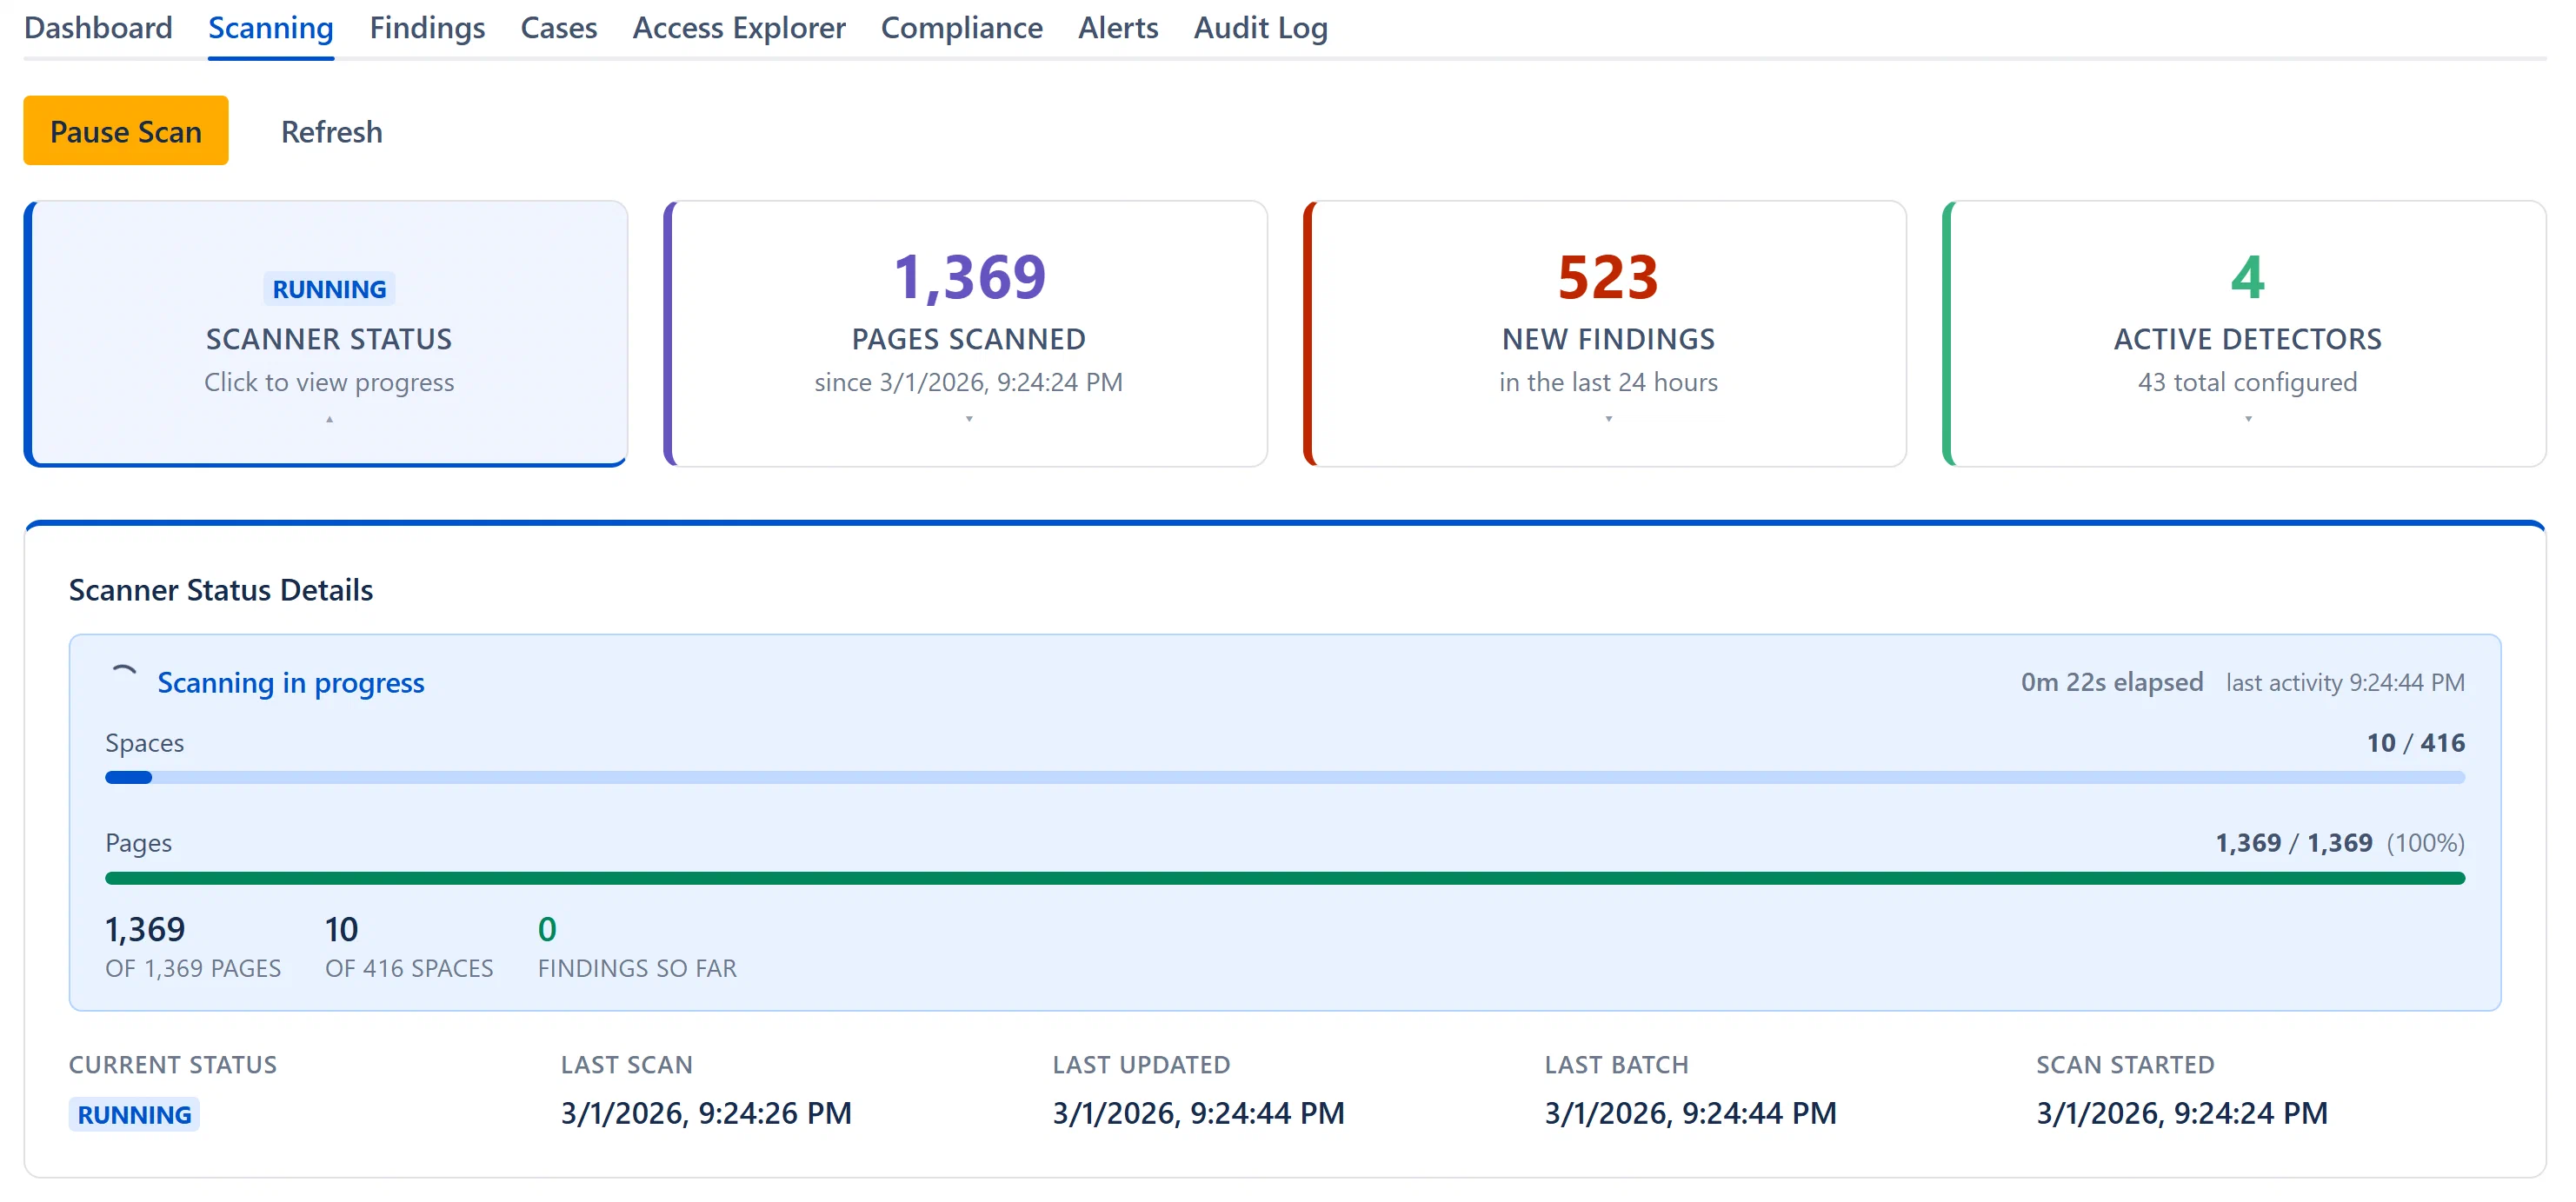
RUNNING (blue): A scan is actively processing pages. The card expands automatically and the subtitle reads “Click to view progress.”
PAUSED (amber): The scan was paused. It will resume on the next Start Scan.
FAILED (red): The last scan hit a fatal error. The error message appears in the expanded panel.
Sub-label: “Click to view progress” while running; “Last scan details” otherwise.
Expanded detail panel (click to expand):
While a scan is running, the expanded panel shows the real-time progress view:
Header: “Scanning in progress” with a live elapsed timer (e.g., “12m 34s elapsed”), counting up in real time from when the scan started.
Spaces progress bar: Shows “Spaces X / Y”, the fraction of all Confluence spaces that have been fully processed.
Pages progress bar: “Pages X / Y (Z%)”, appears once Aegis has computed the total expected page count. Turns green at 100%.
Key metrics row:
Metric
Description
Pages Scanned
Pages processed so far.
Spaces Completed
Spaces fully done out of the total.
New Findings
Net-new findings created in this run (shown in red). Appears once at least one finding is created.
Reopened
Previously-resolved findings re-detected by the scanner (shown in orange).
Note: During the brief “Starting scan…” phase, the metrics show zeros while the orchestrator lists spaces and distributes work. Numbers appear within a few seconds.
When a scan is idle or complete, the expanded panel shows:
Current Status (lozenge)
Last Scan (date/time of the last completed scan; shows “Never” if no scan has run)
Last Updated (when the scan cursor was last written)
Last Batch (time of the most recent page batch processed)
Scan Started (for the most recent run)
Scan Window (“All pages” for full/space scans; “Modified since [date]” for incremental)
Displays: Count of scanner findings created in the last 24 hours (not just the most recent scan).
Sub-label: “in the last 24 hours”.
Card color: Turns red when any findings exist from the past 24 hours.
Expanded detail panel (click to expand):
Findings Breakdown:
Total Active (all active scanner findings across all time)
Last 24 Hours (findings created in the past 24 hours)
New This Scan (findings created in the most recent scan run)
Reopened (findings reopened in the most recent scan run)
Severity breakdown: Four colored tiles (Critical, High, Medium, Low) each clickable to jump to the Findings tab filtered by that severity.
A “View in Findings →” link.
Why 24 hours instead of per-scan? If you run two scans within a day, the card accumulates findings across both. This gives a truer picture of new exposure even when running multiple targeted scans.