Title here
Summary here
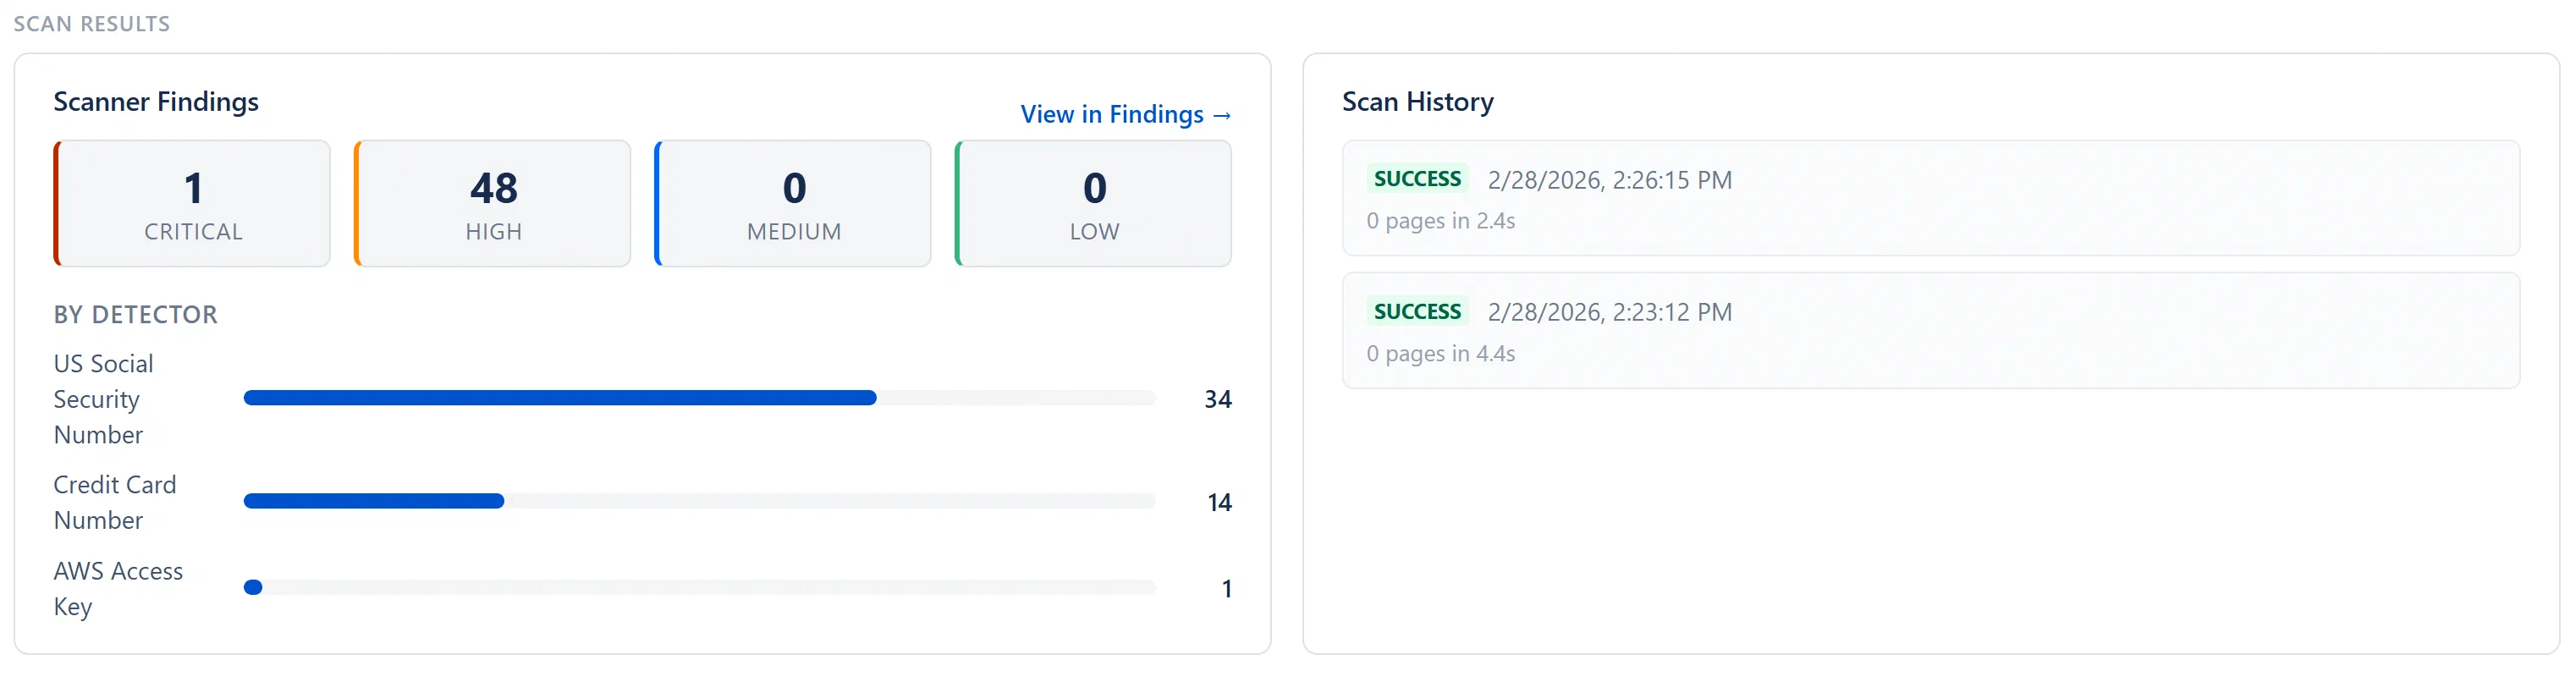
Below the stat cards, the Scanning tab shows two side-by-side panels labeled “Scan Results”.
Shows a severity breakdown of all currently active scanner findings (across all scan runs, not just the most recent):
If no active scanner findings exist: “No active scanner findings. Run a scan to detect secrets and PII.”
A chronological list of all scan job runs. Each entry is expandable: click any row to see the full detail panel for that run.
Summary row (always visible):
Expanded detail (click to open):
| Field | Description |
|---|---|
| Status | Final run status lozenge. |
| Scope | The scan scope: “All spaces” for a full scan, the space name for a targeted space scan. |
| Started | Date and time the run began. |
| Duration | How long the scan ran, formatted as “Xm Ys”. |
| Pages Scanned | Total pages processed in this run. |
| Spaces | Number of spaces fully completed. |
| New Findings | Net-new findings created during this run. |
| Reopened | Previously-resolved findings re-detected and reopened in this run. |
| Error | Error message, if the run failed. |
Note: Stats (Pages Scanned, New Findings, Reopened) are recorded when the scan finishes. Runs that are still running show live progress inside the Scanner Status card instead.
If any scanner findings exist, a Recent Detections panel appears below the Scan Results section. This is a paginated list (15 per page) of the most recent findings created by the scanner, showing:
| Field | Description |
|---|---|
| Title | The finding title, generated by the detector (e.g., “AWS Access Key detected”). |
| Page link | The Confluence page title, clickable to navigate directly to the affected page. |
| Detector lozenge | The detector that triggered the match (e.g., “aws-key” in red, “email-address” in orange). |
| Severity lozenge | The severity level as set by the detector’s configuration. |
| Match count | If the detector found more than one match on the same page, a “N matches” count is shown. |
Clicking any row navigates to the Findings tab filtered to scanner source.
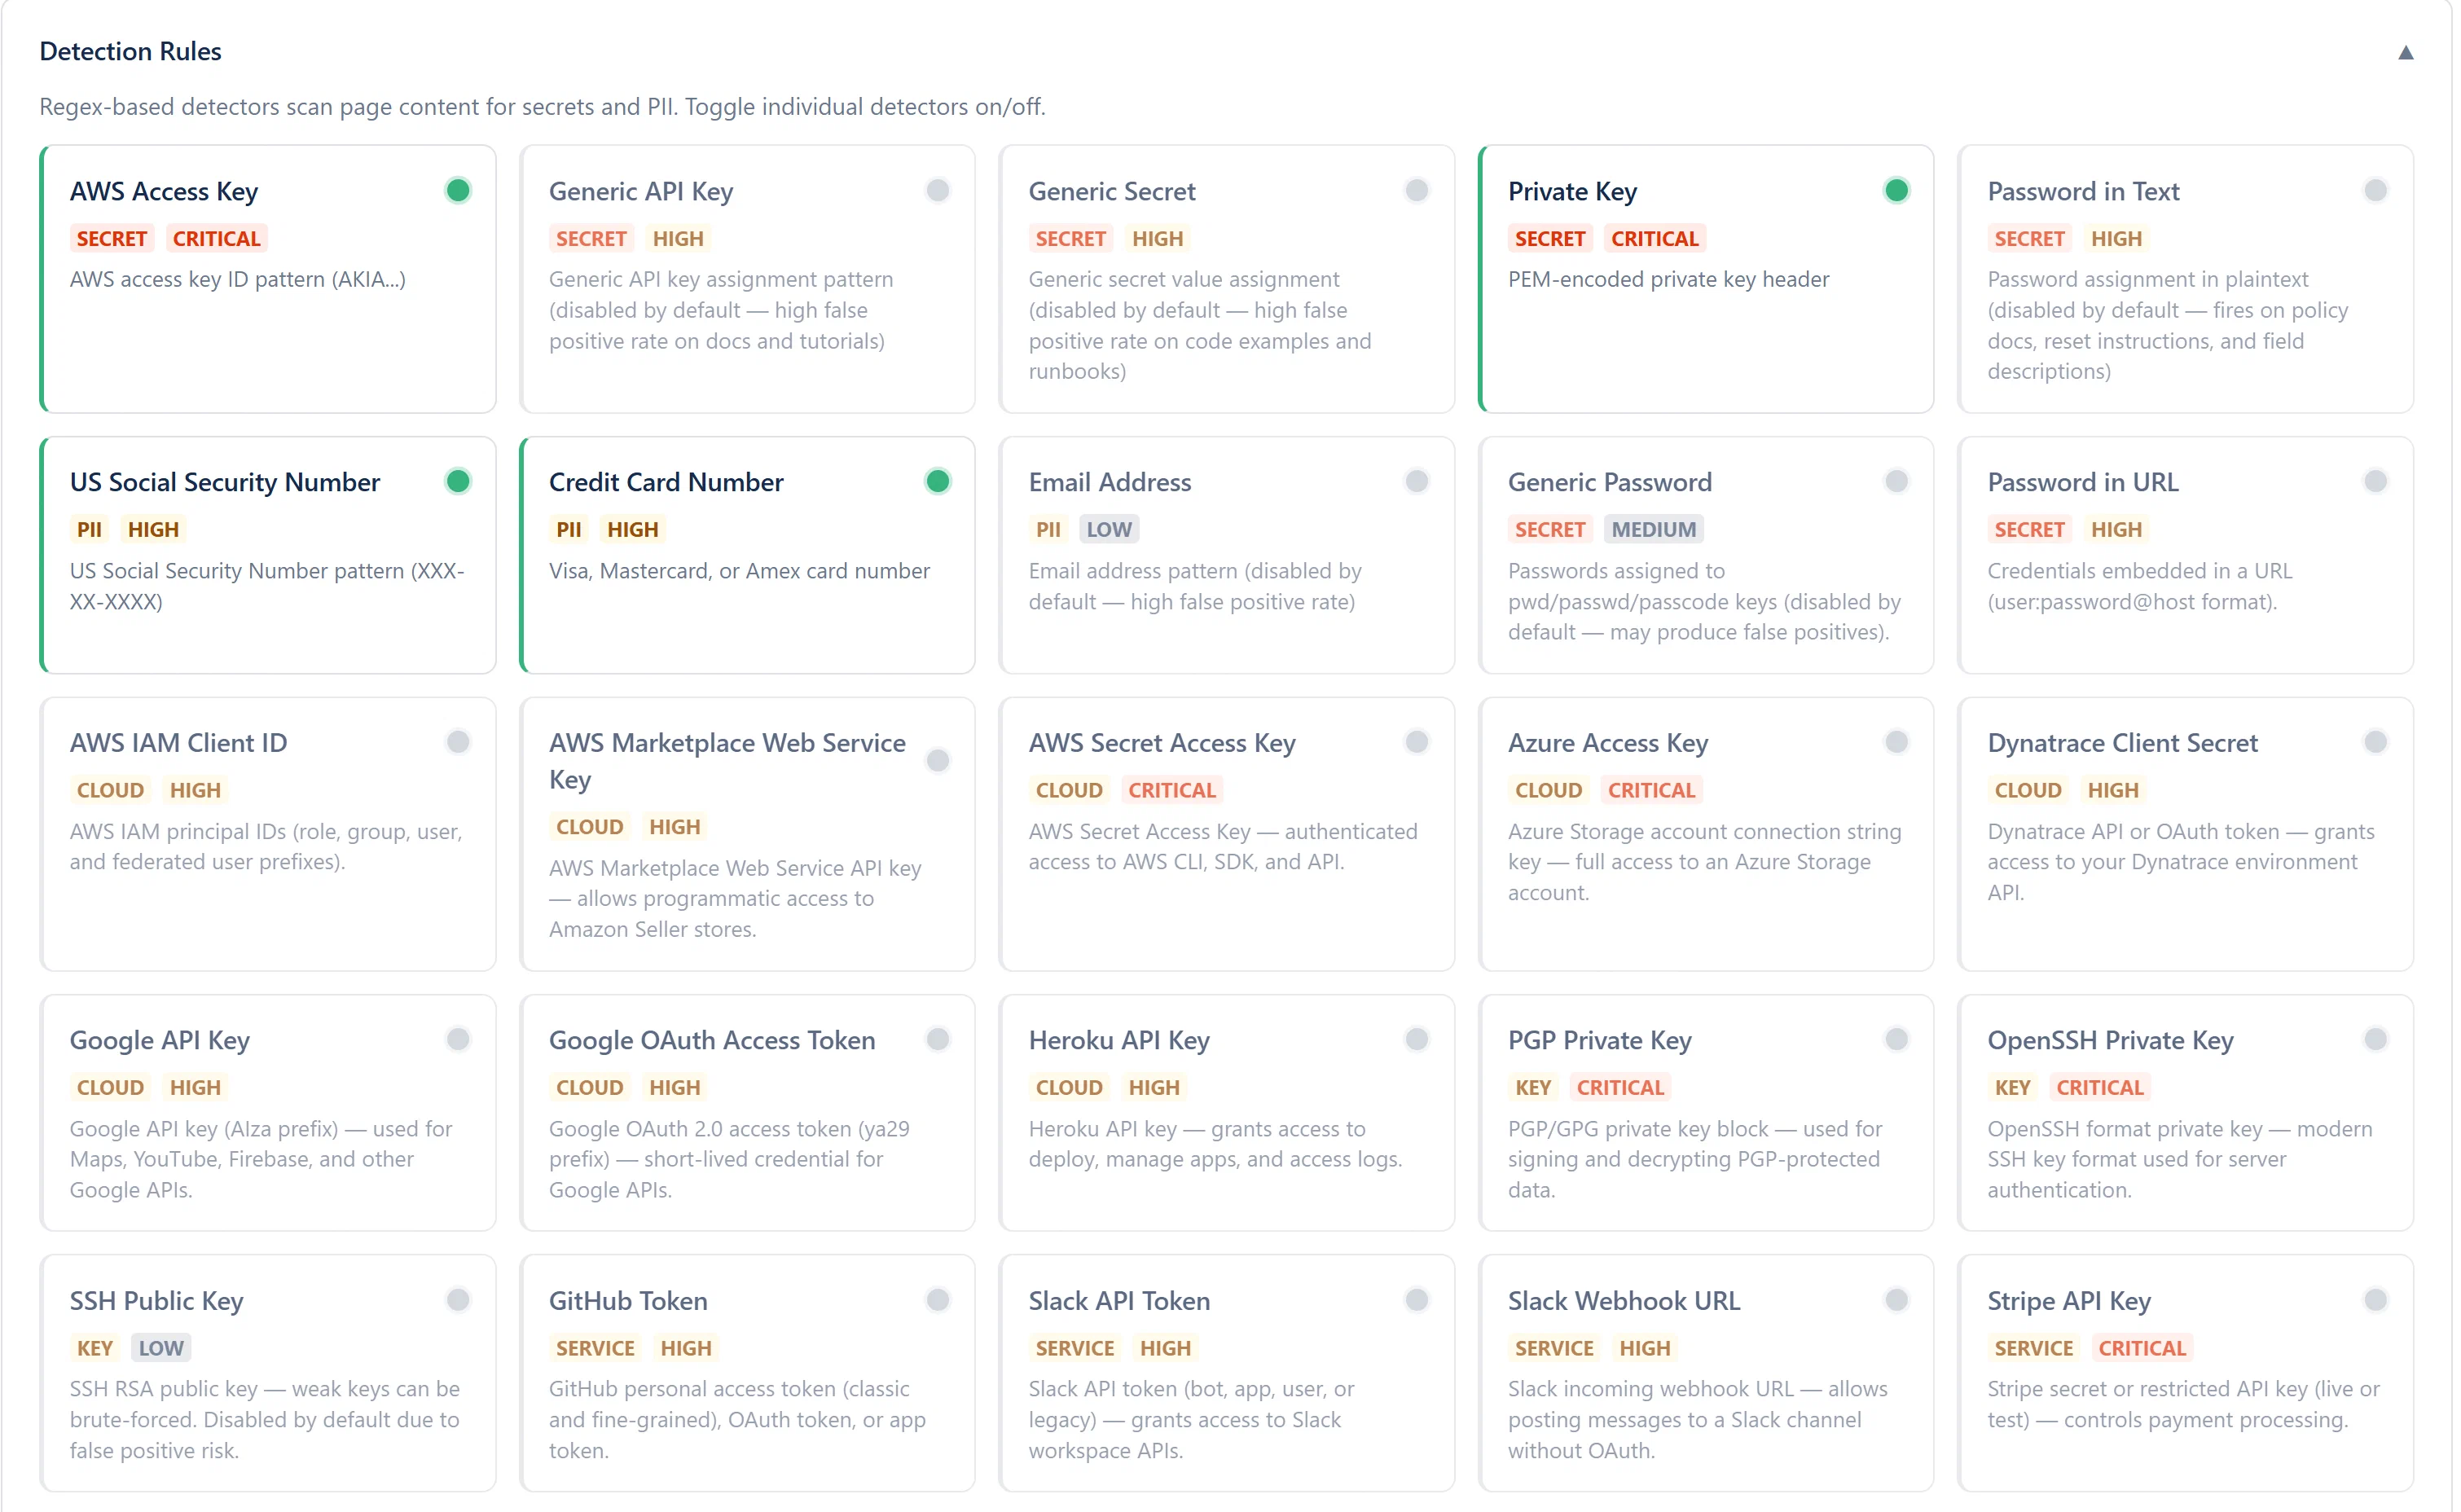
At the bottom of the Scanning tab, Admin users see a collapsible Detection Rules panel. Clicking the panel header expands a card grid showing all configured detectors. Each detector card shows:
Admin users can toggle a detector on or off by clicking its card. The change takes effect optimistically in the UI immediately and is saved to the backend. The toggle is reflected in the Active Detectors stat card count in real time.
A collapsible “How It Works” panel at the bottom explains the scanning architecture in plain English:
“The content scanner is triggered manually from Admin > Scanning. It fetches page body text via CQL, runs all enabled detectors, and creates findings for matches. Raw content is never stored, only SHA-256 hashes for deduplication. Resolved findings are automatically reopened if the same secret is detected again.”
Key points worth noting:
contentId + detectorId + matchedText is stored to enable deduplication across runs.reopenedAt timestamp is set.| Scenario | Recommended Scan Mode |
|---|---|
| Initial setup, first scan ever | Full scan |
| Weekly security hygiene | Incremental scan (fast, covers recent changes) |
| After a major content migration | Full scan (to catch any newly imported content) |
| After enabling new detectors | Full scan (incremental only checks recently modified pages) |
| Investigating a specific space after an incident | Space scan (targeted, no wait for other spaces) |
| After resolving many findings | Incremental scan (to confirm fixes are in place) |